범주형데이터 빈도표와 데이터전처리는 이전 게시글에 있습니다.
https://egg-is-life.tistory.com/12
004. 사용한 코드 정리_기초통계 및 막대 그래프 코드 정리(1)
목차 1. 데이터 불러오기 및 열 이름 변경 2. 데이터 공란 채우기(NaN) 3. 데이터 frequency table(빈도표) 작성 1. 데이터 불러오기 및 열 이름 변경 문항 번호로 적혀 있던 열 이름을 어떤 항목인지 알
egg-is-life.tistory.com
https://egg-is-life.tistory.com/13
005. 사용한 코드 정리_기초통계 및 막대 그래프 코드 정리(2)
1. 범주형 데이터 frequency table(빈도표) 그리기 해당 내용은 이전 글에 정리해두었다. https://egg-is-life.tistory.com/12 004. 사용한 코드 정리_기초통계 및 막대 그래프 코드 정리(1) 목차 1. 데이터 불..
egg-is-life.tistory.com
# plt.show() 그래프 안 나오는 오류 해결
%matplotlib inline
# 한글 안 나오는 오류 해결
from matplotlib import font_manager, rc
font_path = 'C:/Users/lifeisegg/AppData/Local/Microsoft/Windows/Fonts/NanumSquare_0.TTF'
font_name = font_manager.FontProperties(fname=font_path).get_name()
rc('font', family=font_name)
colors = ["#7F7F7F","#7F7F7F"]
sns.set_palette(sns.color_palette(colors))
titles = ["~~", "~~", "~~", ...]
datas = ['result_medicine_care', 'result_medicine_help', 'result_medicine_conv', 'result_medicine_func', 'result_nutrition_care', 'result_nutrition_help', 'result_nutrition_conv', 'result_nutrition_func', 'result_exercise_care', 'result_exercise_help', 'result_exercise_conv', 'result_exercise_func', 'result_kiosk_care', 'result_kiosk_help', 'result_kiosk_conv', 'result_kiosk_func', 'result_safety_relax', 'result_safety_help']
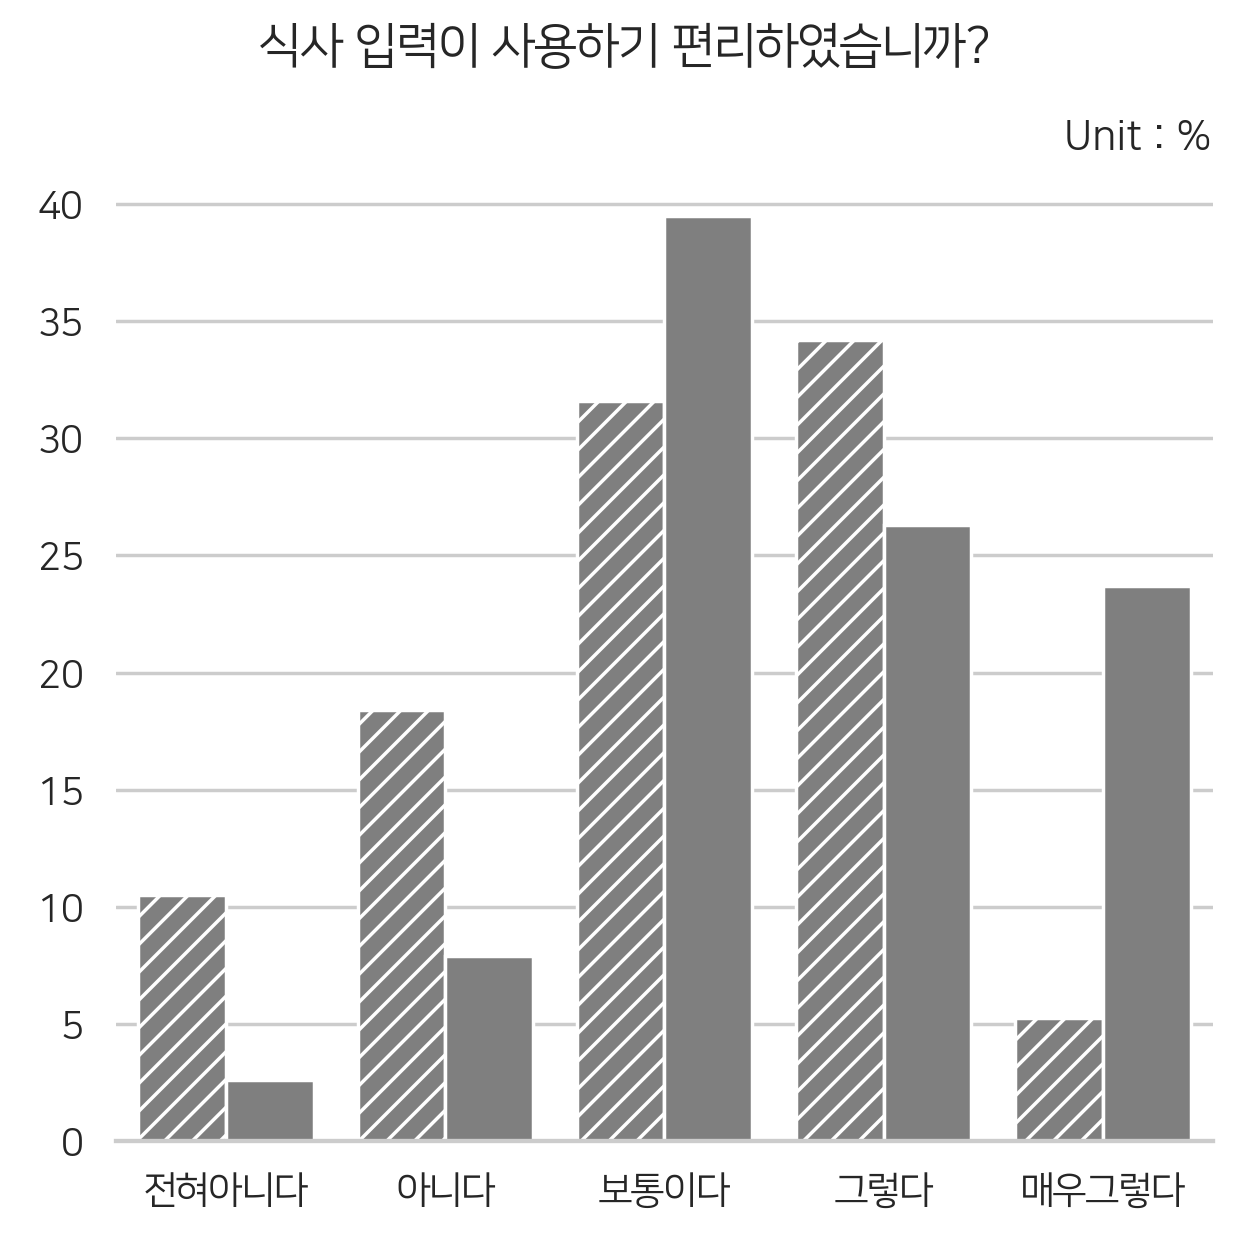
#seaborn막대그래프에 패턴 넣기(1)
from itertools import cycle
hatches = cycle(['///', ''])
#그래프 여러 개 그려서 저장하기
for i in variable:
plt.figure(figsize=(90,150))
num_locations = ['전혀아니다', '아니다', '보통이다', '그렇다', '매우그렇다']
g = sns.catplot(data=globals()['result_{}'.format(variable.index(i))], x=i, y='percent', kind='bar', hue='que',
order=['전혀아니다', '아니다', '보통이다', '그렇다', '매우그렇다'], legend=False)
#seaborn막대그래프에 패턴 넣기(2)
for k, patch in enumerate(g.ax.patches):
if k % len(num_locations) == 0:
hatch = next(hatches)
patch.set_hatch(hatch)
g.ax.legend(loc='center left', bbox_to_anchor=(1, 0.5))
plt.gca().spines['left'].set_visible(False)
plt.ylabel("")
plt.xlabel("")
plt.suptitle(titles[variable.index(i)], fontsize=14)
plt.title("Unit : %", loc='right')
plt.tight_layout()
plt.savefig(i, dpi=250, figsize=(90,200))
'프로그래밍 > 코드정리' 카테고리의 다른 글
| 005. 사용한 코드 정리_기초통계 및 막대 그래프 코드 정리(2) (0) | 2021.08.21 |
|---|---|
| 004. 사용한 코드 정리_기초통계 및 막대 그래프 코드 정리(1) (0) | 2021.08.21 |


댓글